
English
Views: 222 Author: Farwise Lighting Publish Time: 2026-10-17 Origin: Site


Content Menu
● What Does a Luminous Intensity Distribution Diagram Show?
>> Luminous Intensity, Light Output, and Surface Illumination
● How to Read a Luminous Intensity Distribution Diagram
>> Identify the Luminaire's Orientation
>> Check Whether the Values Are Absolute or Normalized
>> Compare the Measurement Planes
>> Follow the Shape, Not Just the Peak
● Beam Angle and Field Angle: An Important Distinction
● Why LED Silicone Strip Lights Need Assembly-Level Evaluation
>> Evaluate the Configuration You Intend to Install
● Applying Light Distribution Curves to Furniture Lighting
>> Under-Cabinet Lighting: Consider the User's Position
>> Wardrobe Lighting: Test Beyond an Empty Cabinet
>> Bathroom and Bedroom Lighting: Prioritize Viewing Comfort
● A Practical Workflow for Evaluating Light Distribution
>> Step One: Define the Lighting Task
>> Step Two: Request Relevant Photometric Information
>> Step Three: Review the Installation Geometry
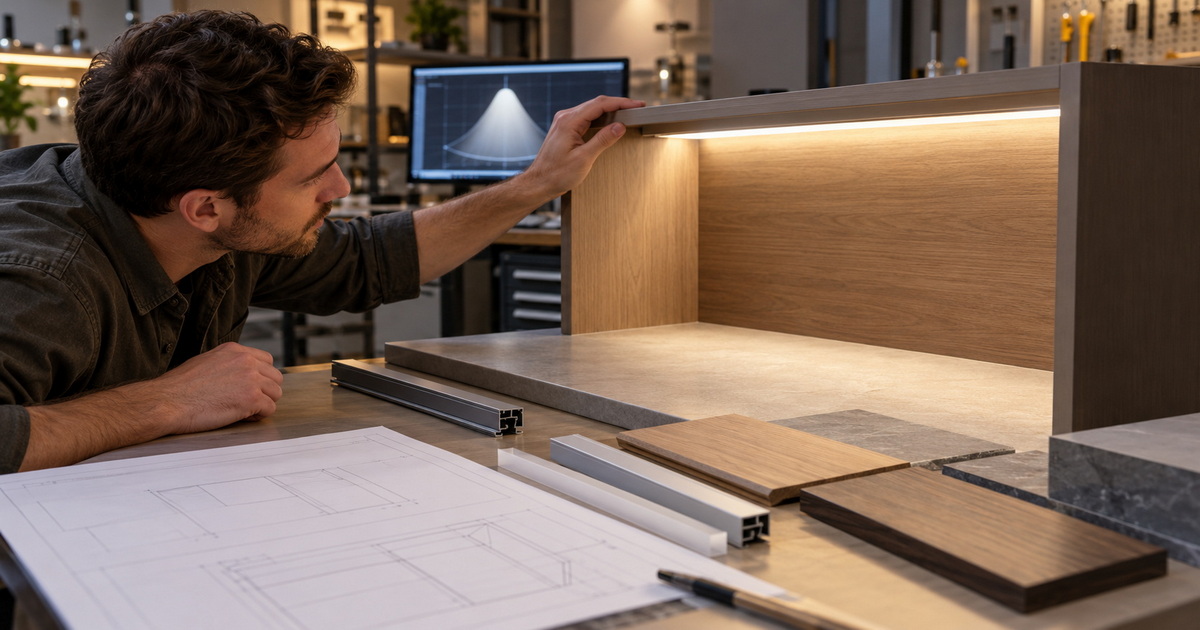
>> Step Four: Build a Representative Mock-Up
>> Step Five: Record the Approved Configuration
● What a Light Distribution Diagram Cannot Prove
>> Understand the Limits of Close-Range Calculations
● Turning Photometric Knowledge into an OEM/ODM Brief
>> 1.Is a Luminous Intensity Distribution Diagram the Same as a Lux Map?
>> 2.Can Two LED Strips Have Similar Output but Different Lighting Effects?
>> 3.Does a Wider Distribution Always Improve Cabinet Lighting?
>> 4.Can I Use Bare-Strip Photometric Data for a Silicone-Covered Assembly?
>> 5.Do I Need an IES File for Every Furniture Lighting Project?
>> 6.Can a Distribution Curve Guarantee Glare-Free Lighting?
A luminous intensity distribution diagram shows how strongly a light source emits light in different directions. For anyone selecting LED silicone strip lights, it helps answer a practical question: where will the light go after installation?
In furniture lighting, that question matters as much as total light output. A strip can look attractive on a sample board yet create reflections on a countertop, leave wardrobe shelves in shadow, or expose an uncomfortable bright line beneath a bed.
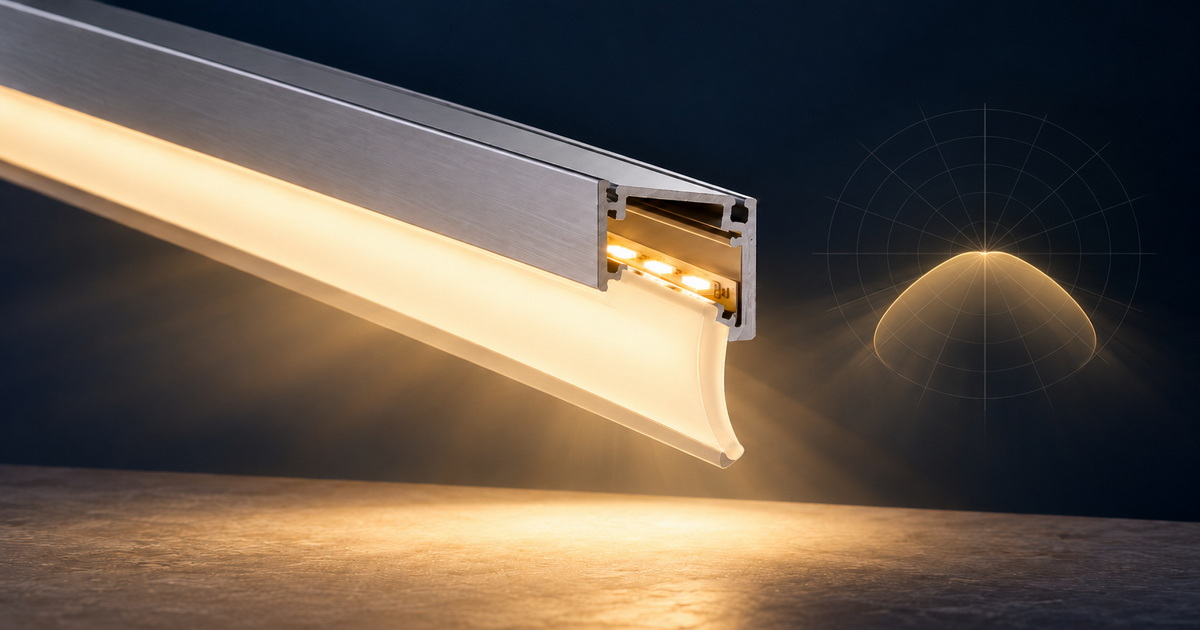
A luminous intensity distribution diagram represents the intensity of light emitted in different directions around a source or luminaire. It is commonly displayed as a polar graph, with curved lines extending around a central point.
Think of it as a directional map rather than a photograph of the finished lighting effect.
The diagram helps designers assess:
- Whether light spreads broadly or concentrates toward a particular direction.
- Whether the distribution is symmetrical or directional.
- How different optical configurations compare.
- Which installation orientation may suit the intended surface.
However, the diagram does not independently show how bright a finished room will appear. That depends on installation geometry, surrounding materials, and other lighting within the space.
These terms describe different things:
| Lighting term | What it describes | Practical question |
|---|---|---|
| Luminous flux | Total visible light emitted | How much light does the source produce overall? |
| Luminous intensity | Light emitted in a particular direction | Where is the light concentrated? |
| Illuminance | Light arriving at a surface | How well is the worktop or shelf illuminated? |
| Luminance | Directional light associated with a visible surface | How bright does the source or reflection appear? |
You do not need to become a laboratory specialist to make a useful first assessment. Start with the diagram's orientation, scale, and curve labels.
Locate the reference direction and check how it relates to the emitting surface.
Do not assume that the bottom of every chart represents the floor in your installation. A furniture light might be mounted horizontally, vertically, or inside an angled channel.
The relationship between the chart and the installed product must be clear before the curve becomes meaningful.
Some diagrams present luminous intensity in candela. Others present normalized values, such as candela per kilolumen.
Absolute values describe the tested configuration's directional intensity. Normalized values help compare distribution shapes independently of total light output.
Two similar-looking curves therefore do not necessarily represent equally bright products. Check the scale and reporting basis before comparing them.
A diagram may include several curves representing different sections through the light distribution.
For linear lighting, the pattern along the strip can differ from the pattern across it. A single curve may hide that distinction.
Look for a drawing or legend showing how the measurement planes relate to the product. This becomes particularly important when evaluating directional profiles or asymmetric optics.
A concentrated peak indicates strong intensity in a particular direction. A broader curve indicates light distributed across a wider angular area.
Neither shape is automatically better.
A useful review asks whether the distribution supports the installation's purpose: lighting a working surface, illuminating wardrobe contents, or creating a concealed decorative glow.
Beam angle and field angle are related, but they are not interchangeable.
Under commonly used lighting definitions, beam angle describes the angular span between directions where intensity falls to half the maximum. Field angle uses a lower threshold and describes a wider part of the distribution.
These terms are especially useful for directional beams. They are less informative when used alone to describe a long, diffuse furniture light.
A single beam-angle description cannot fully explain:
- Differences between longitudinal and transverse distribution.
- Reflections from polished furniture surfaces.
- Light blocked by cabinet edges.
- Visibility of the emitting surface.
- Illumination inside nearby compartments.
For strip-light projects, evaluate the complete curve alongside the mounting arrangement instead of making the purchasing decision from one angle.
The finished lighting system is more than the LED strip itself.
Silicone encapsulation, diffuser geometry, channel walls, and mounting position can influence how light leaves the assembly. Diffusing materials can soften the visible light source, but they can also change distribution and transmitted output.
This means photometric information for an exposed strip should not automatically represent the same strip inside a covered furniture profile.
Request information that corresponds to the proposed assembly, including its optical cover and mounting arrangement.
If the design changes during development, ask whether the existing photometric information remains representative.
Changes worth reviewing include:
- Replacing the diffuser material or shape.
- Introducing a deeper or angled profile.
- Changing the exposed emitting surface.
- Adding shielding around the light source.
- Reorienting the assembly within the furniture.
From a specification perspective, the important question is not simply whether a supplier has a lighting diagram. It is whether that diagram describes the configuration being purchased.
The same strip can produce different results depending on where it is installed. Begin with the furniture's function, then assess the distribution against the actual geometry.
| Application | Main lighting objective | Distribution-related concern | Recommended review |
|---|---|---|---|
| Under-cabinet lighting | Illuminate the working surface | Light misses the useful area or creates reflections | Compare mounting positions in a realistic mock-up |
| Wardrobe lighting | Make stored items easier to see | Shelves and hanging clothes obstruct light | Review illumination with the wardrobe populated |
| Bathroom cabinet lighting | Support comfortable everyday use | Visible sources reflect in mirrors or glossy surfaces | Inspect normal standing positions |
| Bed lighting | Provide gentle orientation or ambience | The emitting surface is visible from the bed | Check seated and reclining viewpoints |
| Display shelving | Draw attention to objects | Bright foregrounds leave objects in shadow | Evaluate objects against their background |

A worktop is not an empty test surface. People, appliances, splashbacks, and cabinet edges affect the result.
Review whether the light reaches the useful working area and whether the source appears as a distracting reflection. Moving the light within the cabinet recess may change the outcome more effectively than increasing output.
An empty wardrobe can make almost any light appear effective.
The more useful assessment includes shelves, clothing, and darker internal finishes. Check whether the distribution reaches lower compartments and whether hanging garments block important light paths.
A concealed strip is not necessarily concealed from every viewpoint.
Bathroom mirrors can reveal an otherwise hidden source. A bed-mounted strip may become visible when someone reclines.
Review the installation from realistic eye positions, not only from the viewpoint used for a promotional photograph.
A repeatable process helps turn a technical diagram into a purchasing decision.
Decide whether the installation supports work, storage visibility, display, orientation, or atmosphere.
Avoid vague instructions such as "make it brighter." Describe what users need to see and where they will stand, sit, or move.
Ask for the distribution diagram and, where available, a corresponding IES or LDT photometric file.
These files allow compatible lighting software to use directional light data in a project model.
Confirm that the file matches the proposed assembly rather than a visually similar alternative.
Include furniture edges, recesses, shelves, and adjacent surfaces.
These details can block useful light or create reflections. A distribution curve becomes much more informative when connected to the installation drawing.
Use the intended diffuser, furniture finish, and mounting position.
Inspect the sample from normal viewing positions. Look for visible light points, distracting reflections, uneven coverage, and unwanted shadowing.
These are inspection questions, not assumed customer complaints or evidence of a particular product's performance.
Keep the agreed assembly, orientation, and sample reference together.
This makes later discussions clearer and helps prevent substitutions from being treated as optically equivalent without review.
A distribution curve is valuable evidence, but it is not a complete quality assessment.
It does not independently establish:
- Long-term reliability.
- Color consistency between production batches.
- Electrical safety or moisture suitability.
- Dimming compatibility.
- Thermal performance inside furniture.
- The absence of visible dots or reflections.
Similarly, initial photometric testing does not establish lifetime performance.
Furniture lighting often operates very close to the surfaces it illuminates.
Conventional far-field photometric data may not fully describe local effects at these distances, particularly around extended linear sources. Source geometry, shielding, and individual light points can become important.
For close-range installations, use calculations as a design aid and validate the result with a representative physical sample.
A strong customization brief describes the intended lighting experience, not just the shape of the product.
Include:
- Furniture drawings and installation locations.
- The surfaces or objects that need illumination.
- Normal viewing positions.
- Relevant surface finishes.
- Preferences for concealed, direct, or reflected light.
- Control requirements and operating expectations.
- The sample-review and approval process.
Farwise Technology Co., Ltd. brings 16 years of LED lighting manufacturing experience to commercial and residential furniture-lighting projects. Its offering includes LED silicone strip lights and lighting solutions for cabinets, wardrobes, bathroom furniture, and beds.
Farwise supports OEM/ODM customization across dimensions, functions, appearance, and lighting solutions. These capabilities allow the discussion to begin with the furniture application rather than an isolated component.
Share your furniture drawings, intended lighting effect, mounting constraints, and control requirements with Farwise. Request a tailored proposal and representative sample so the lighting concept can be reviewed before production approval.
No. A distribution diagram describes light emitted in different directions. A lux map describes illumination arriving at surfaces within a defined installation. Creating a useful lux map requires information about positioning, geometry, and the surrounding environment.
Yes. Similar total output does not guarantee similar directional distribution. Optical covers, profiles, and installation orientation can change where light travels and how the source appears within the furniture.
No. A wider distribution may improve coverage, but it can also direct light toward unnecessary surfaces or uncomfortable viewing directions. The right choice depends on cabinet geometry and the task being illuminated.
Not automatically. The silicone cover and surrounding assembly may alter the optical result. Ask whether the available data represents the finished configuration and whether additional evaluation is needed.
Not every project requires a full lighting simulation. However, a matching photometric file is useful for professional calculations and comparisons. Small, close-range installations still benefit from practical sample testing.
No. Discomfort depends on source visibility, luminance, reflections, and viewing position. Review the curve alongside the installation design, then inspect a mock-up from the positions users will actually occupy.
1. [Mingxue LED — "What Is a Luminous Intensity Distribution Diagram?"]
Original article, published March 8, 2024. Used as the starting point for restructuring; this guide expands its practical scope and clarifies the beam-angle and field-angle distinction. [mingxueled]
2. [International Commission on Illumination — "Luminous Intensity Distribution," e-ILV Term 17-29-037]
Authoritative terminology defining intensity distribution as directional values represented through curves or tables. [cie.co]
3. [TRILUX — "Luminous Intensity Distribution Curve"]
Technical explanation of polar curves, measurement planes, normalized intensity values, and lighting-data formats. [trilux]
4. [Illuminating Engineering Society — "Beam Angle"] and ["Field Angle"]
Definitions supporting the distinction between the two angular measures. [ies]
5. [CIBSE Journal — "Module 176: LED Luminaire Optical Control for Office and Educational Applications"]
Technical discussion of how lenses, reflectors, and diffusers influence luminaire distribution, including the role of diffusing materials. [cibsejournal]
6. [U.S. Department of Energy — "Understanding LM-79 Reports"]
Explains directional intensity measurements, configuration-specific photometry, and why initial measurements do not establish lifetime performance. [betterbuildingssolutioncenter.energy]
7. [Illuminating Engineering Society — "Learn About IES Files"]
Explains standardized digital files containing directional light-distribution information for lighting calculations. [ies]


